IIIT A Bi Monthly e-Magazine
Volume I Issue II
January-February 2005
Insight
Brainwave
X`pressions@iiita
Perspectives
URL
Limelight
Volteface
Casecading
CampusBuzz
Technova
Jest Corner
Feedback
The Team
Help Me
INSIGHT

Life Style and Health by Dr Arpita Khare: The evolution of markets has been to a great extent, responsible in bringing about a change in the lifestyle of the community as a whole. Read More>
PERSPECTIVES
How could the fairness soaps segment be made more relevant? B. R. Rejoy Kurup, PGP Student, Indian Institute of Management Ahmedabad

Buzz Marketing: Is it the 'Right' way: Manasi Bansal
Batch 2004-06
Indian Institute of Management Lucknow

Global Branding: What makes brand truly global: Aishwarya Natarajan,
Post-Graduate Programme in Management ,
Amity Business School, Noida.

Learning to Ask IT the Right Questions: Amritpal Singh
Fulltime Graduate Student
MBA Program
Barney School of Business
University Of Hartford, USA

X'PRESSIONS
Economic Growth : A Compilation of thoughts and works of Joel Mokyr (The Lever of Riches), Paul M. Romer (Theory, History, and the Origins of Modern Economic Growth), Robert Solow, Adam Smith and Joseph Schumpeter by Sumil Krishna Sharma, MBA, IIITA

Unravelling the Phenomenon called Gandhi: Ashutosh Kumar
PGD in Cyber Law and Security
IIIT-Allahabad

Business Intelligence: The Enterprise Success Mantra by Jayant Sahu, MBA - IT, IIIT- Allahabad
Liberation by Mayank Garg B. Tech (6th Semester) IIIT Allahabad

TECHNOVA
Information Technology: How it can be helpful in the case of Natural Disaster by Vijay Kr. Chaurasiya
Faculty Member
IIIT- Allahabad

Human Rights Transcend Computer Rights by By Bhaskar Gupta
B. Tech. IIIT - Allahabad


Business Intelligence: The Enterprise Success Mantra


JAYANT SAHU
MBA-IT
IIIT- ALLAHABAD


Gartner, an information technology research firm, coined the term "business intelligence" during the 1990s.Business intelligence (BI) generally refers to the process of transforming the raw data companies collect from their various operations into usable information. Since data in its raw form is of fairly limited use, companies are increasingly electing to use business intelligence software to realize their data's full potential. BI software comprises specialized computer programs that allow an enterprise to easily aggregate, manipulate, and display data as actionable information, or information that can be acted upon in making informed decisions.

For example, consider the data collected at a supermarket. Tens of thousands or even hundreds of thousands, of transactions are recorded at the checkout counter every day. Looking at this transactional data in its raw form, one could glean basic information such as which item was sold, when it was sold, and how much it was sold for. However, by implementing BI software, the supermarket can turn that raw product data into information and use that information to gain more profound insight into their business. In addition to determining how many containers of milk were sold on any given day, the supermarket can determine bigger-picture insight such as how discounts and promotions impact sales trends, which items are selling best in each department, and which of their store locations is best at selling a specific product line.

Armed with this knowledge the supermarket's management can better plan for the future. By tracking buying trends of the customers, the purchasing department knows which products to stock up on. Moreover, management can obtain such information as products that are commonly purchased together, like hotdogs and mustard, so that they can better position them on the shelves, thereby increasing revenue.


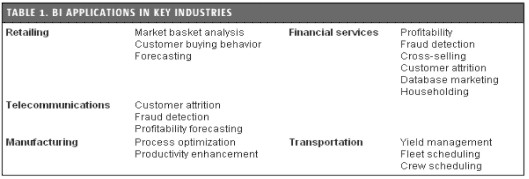
Fig 1: Applications of BI

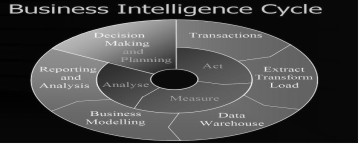
Fig 2: The Four Linked Components of BI Cycle


A healthy BI strategy should be viewed as the sum of four major components that fit together in a constant cycle. These four components are Measure, Analyze, Plan, and Act/Improve.

Measure

The measure phase is by far the most widely deployed and far-reaching component of Business Intelligence .In the Measure phase, companies report the current and historical status of key metrics used to manage their business. These measures tell a company the "what," i.e., "What is the status or health of my business?" Although most companies know which fundamental indicators to measure, such as sales or profit, it is not necessarily easy for them to obtain and distribute the status of these measures to the individuals throughout their organization. By employing an effective BI solution, an organization can successfully distribute this information to all the people who affect business inside and outside the enterprise. And through a BI application, an organization can uncover new ratios and metrics that provide even deeper insight and that could potentially modify or enhance what is currently measured. Today, reporting and information delivery software used widely by IT departments provides the bulk of the functionality in this initial phase of the BIC.

During implementation of the measure stage, a stabilization of the company's overall BI infrastructure occurs. People viewing measures can determine inconsistencies with the aggregated measures and what is generally expected. This helps to uncover glitches in the collection processes. Determining problems with data collection and connecting them is a necessary evolution that takes place during the measurement stage.


Without this weeding out of collection problems, companies cannot successfully move into the latter stages of the cycle because to base analysis and planning on a suspect measurement system makes no sense.


Analyze


During the second phase in the BIC, analysts review and measure the data in new and different ways to see whether they can uncover hidden relationships that will help them answer "why," i.e., "Why is this occurring?" In the evolution of BI, several tools have emerged that simplify the analytical process .These are ad hoc query, ad hoc reporting, online analytical processing (OLAP), and advanced data visualization.
Plan


After determining some of the reasons why things occur in the analyze phase, companies then try to determine the effects on outcomes should they implement changes. This is when the third part of the cycle, the plan phase, begins. In this phase, companies use tools to play "what if" games with their data, i.e., varying scenarios that target the process changes they may need to make to help steer the company in the right direction. Software for this segment of the BIC has been categorized as planning, budgeting, and forecasting. Using these kinds of tools, one can perform scenarios such as "expected measures from the budgeting process" and then combine them with historical measures and forecasting algorithms to determine potential future outcomes. One can then vary inputs to see how different courses of action might affect these outcomes.


During the plan phase, for example, management may determine that, based on expected operating expenses, profits will be down in the next quarter. Using planning software, they can determine how much more they would need to sell to realize the same profits as last quarter. Or, they may try to see how an increase in price for certain items would affect their bottom line if the same number of items were sold. Such a planning application enables a company to determine what steps they will need to take to keep the company on a strategic course toward meeting its goals.


Improve


The plan phase logically progresses into the fourth stage of the BIC, called improve or the "how" phase. In this stage, key players within the company discuss outcomes and potential solutions to the problems they have uncovered in the previous stages and then make decisions regarding how to improve them, such as what they can do to positively affect their bottom line. This is where collaboration as part of BI becomes crucial. During review, individuals can annotate and comment on reports and analysis that have resulted from the other stages, or even vote on a course of action. Collaboration functionality within BI simplifies and documents this whole process so each comment, vote, or opinion can be weighed in the final decision. As a result of the improve phase, new areas or dimensions of measure may be added to the upcoming measure phase in order to track the progress of decisions made during the previous cycle.
In this way, a company's BIC is a process of perpetual improvement that keeps inching the company toward perfection.

Reasons for Failure


There is no doubt that a BIC should exist in every organization, but many factors can prevent its becoming a fixed part of a company's culture. These factors generally boil down to a lack of understanding of how people work and a lack of experience with BI software and its best practices. It is imperative to remove these roadblocks to build momentum and get the cycle moving. Here are some of the more significant reasons why the BIC is not effectively established within an organization:

  • Users' skills and desires are misinterpreted
  • Emphasis is put on the wrong stage of the cycle
  • No information self-sufficiency
  • Culture of measurement is not established
  • Disparate tactical BI solutions gain footholds
Rules for Success
Rule #1: Understand the Users
Rule #2: Categorize the users: Use the Clicks Paradigm
Rule #3: Establish Advanced Users as Information Producers and Consumers
Rule #4: Establish a Culture of Measurement
Rule #5: Make BI a Strategic Enterprise Decision

Conclusion: How It Works

The BIC described here should have different levels of emphasis, measurement being most important. Measurement serves as the foundation for the entire cycle, and without it the other stages will never materialize. To ensure success in the measurement stage, all users need to participate in the measurement system. This is accomplished by communicating the company's strategy to all employees and breaking down that strategy into measures that can be easily monitored and distributed to all users.
To reach all employees, a simple method of access and distribution must be set up - one that requires the least possible effort on an employee's part to view the measures. This is known as zero-, one-, and two-click reporting, a method of distribution that will handle the information consumption needs of nearly 95 percent of company's users. The advanced users who need more information can use three- and four-click and greater OLAP and ad hoc tools to produce additional information. In order to satisfy continually growing information requirements, advanced users should be set up as producers of information, with their work contributed back into the system to be viewed and used by other business users.


BRAINWAVE


Software Patent :

Prof. Anurag K. Agarwal
LL.M. (Harvard), LL.D. (Lucknow)
Indian Institute of Management, Ahmedabad


Open Source Software & Intellectual Property Rights:

Yatindra Singh

Judge Allahabad High Court, Allahabad


VOLTE FACE

The roaring battle between open Vs proprietary software
is between Windows Vs Linux.

Views-in-Favour and Counter-Views on this conflagrant battle are solicited. Your views should reach us at b_cognizance@iiita.ac.in latest by March 30'2005

NEWS FLASH


MBA defeated B.Tech 6th Semester in the ongoing cricket series final. Ashish Nasa from MBA was given the Man of the Series award.

© 2005 Indian Institute of Information Technology Allahabad
Designed by Graffiti Studios IIITA